Cloud Infrastructure
Operators were accountable for infrastructure they couldn't see.
- Role
- Sole Designer
- Year
- 2025
- Client
- Dockhive
- Duration
- 2025
( Overview )
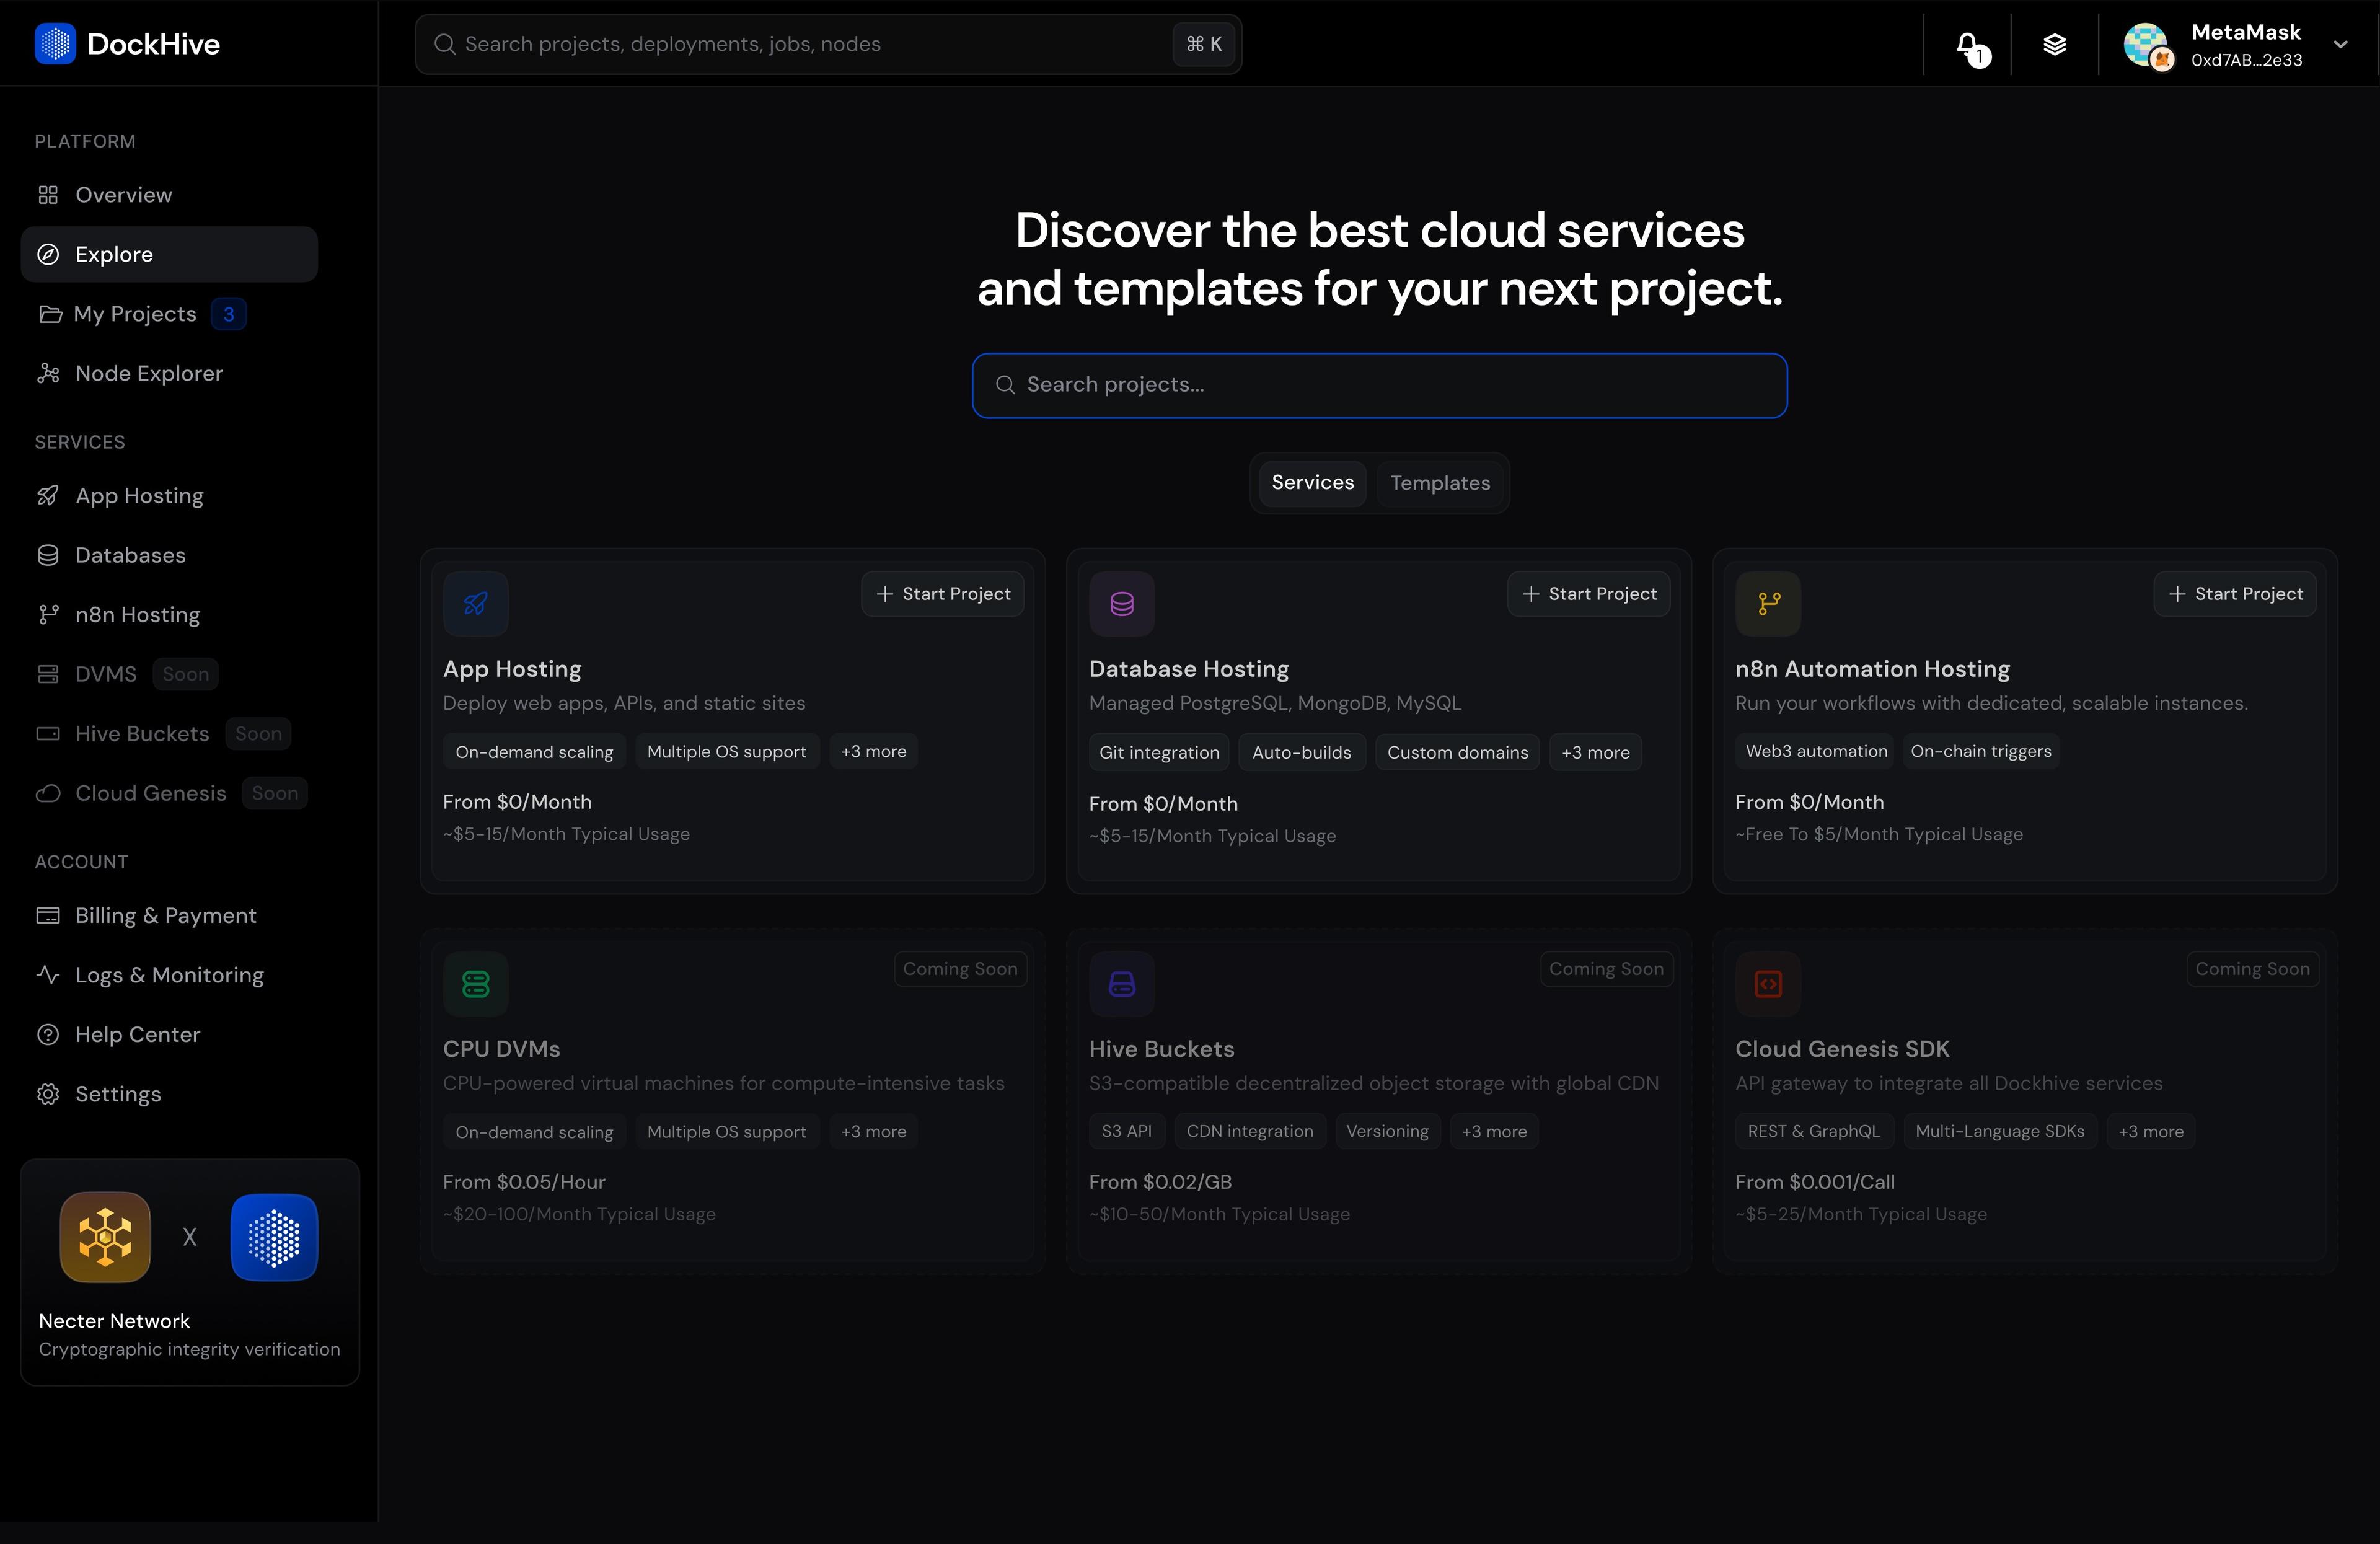
Dockhive is a unified cloud infrastructure platform for app hosting, databases, and workflow automation. As sole designer working with Dockhive's engineering team, I designed two layers: the deployment experience that gets developers to production in under 6 minutes, and the operator visibility layer that keeps them in control once it's live.
( The Problem )
A developer shipping a Next.js app with Postgres and background jobs had to configure Vercel, spin up Supabase, and wire n8n. Three dashboards, three billing pages, three mental models. Average time to first deployment: 45 minutes. Most gave up before finishing. Dockhive unified all three into one platform.
The design problem: make deploying infrastructure feel like something a developer wants to do, not something they have to survive.
( Deployment Flow )
One entry point. Three services: app hosting, databases, and automation. Framework selection is a card grid, auto-detected from the repo. Three steps to deploy anything.
( The Operating Problem )
Getting deployed is one problem. Understanding what's running after is the harder one. DePIN compute operators run nodes across multiple regions, earning rewards from AI workloads running autonomously 24/7. When something goes wrong, they find out when rewards stop.
( Node Explorer )
Before this, operators had a spreadsheet of node IDs — no geography, no topology. Degraded nodes in the same region are a power issue, not a hardware failure. That's a two-minute ISP call, not a truck roll.
( Failure & Response )
The old interface showed one status: Offline. What caused it was left to the operator to reconstruct. The new interface surfaces the likely cause alongside the state — thermal cascade, network drop, hardware stress. An operator responding to an alert at 3am needs the interface to manage cognitive load, not just display information.
( Economic Layer )
Operators aren't running infrastructure for fun — they're earning ETH from AI workloads. The economic layer surfaces earnings, performance, and the direct relationship between uptime and revenue. Degraded nodes cost real money. Now that cost is visible.
( Design Decisions )
- Lagos-first design if the interface works on a phone with 2G connectivity and one thumb, it works everywhere. This constraint shaped tap targets, information density, and progressive disclosure throughout.
- Failure signatures over status codes "Offline" is not actionable. "Thermal throttling cascade, likely cooling system failure" is.
- Four stages, not four tabs incident response is a flow, not a dashboard. Each stage surfaces exactly what the operator needs at that moment.
( Outcomes )
Reflection
Early versions of the operator dashboard showed everything — every metric, every log, every node. It looked comprehensive. In testing with Lagos-based operators on mobile connections, it was unusable: pages took 12 seconds to load, tap targets were too small for one-thumb use, and the information hierarchy assumed a wide monitor and fast internet.
Stripping it back to only what an operator needs at each moment — failure cause, affected nodes, recommended action — made the interface faster, clearer, and more decisive. The Lagos constraint wasn't a concession. It was the design principle that made the product work for everyone, including the San Francisco operators who never knew they needed it.
<6min
Time to deploy, down from 45min
84
Network nodes across 6 regions at launch
89%
Service identification on first try, up from 34%
↓40%
Reduction in operator churn
Next project
Enterprise Reward System